April 29, 2021
No ethical justification exists for government interference of human interaction. Lockdowns, even of short duration, cause suffering and premature death on a scale far greater than could SARS-CoV-2, no matter how many people get infected. Aside from the unconscionable tradeoffs, there is an abundance of evidence to suggest that lockdowns are not even effective at COVID-19 mitigation. A number of scientific studies have concluded that lockdowns have little to no effect on the pandemic as measured by the number of COVID cases, COVID hospitalizations, and/or COVID deaths. Furthermore, some researchers posit that more restrictive measures actually exacerbate the pandemic.
Lockdown propagandists have frequently showcased studies which allegedly proved that lockdowns were effective at coronavirus containment. “Lockdowns saved thousands of lives, according to a new report” is an oft-heard claim in the press.
As a universal truth, it is important to recognize the impossibility of knowing how today would be different if yesterday had been different. Everyone has opinions that if alternative X had been made in the past, outcome Y would have transpired. Yet it is impossible to know for sure how alternate choices in the past would have affected our world. If you had a time machine and were able to go back in time to change an important event, the most you could do was guess at what changes you could make in the past so that the present would be better. No mortal has the power of knowing what would have been.
Retrospective lockdown effectiveness studies are thus highly amenable to fraud. Any numbersmith can create a formula to attribute a decrease in COVID cases to lockdown restrictions or estimate that COVID cases and deaths would have been considerably greater were it not for lockdowns. The German government reportedly has paid scientists to fabricate a model showing a large amount of deaths from COVID. The media only reports studies which posit that lockdowns have decreased the spread of coronavirus and dutifully ‘saved lives.’ It doesn’t matter how poor the quality of the study or the conflicts of interest involved. Conversely, high quality studies which postulate that lockdowns have not meaningfully lowered COVID cases or deaths are consistently buried.
Fortunately, all is not lost for those without a degree in epidemiology. There is compelling evidence regarding the effectiveness of lockdowns in controlling SARS-CoV-2 that can be understood by anyone. The evidence strongly supports the hypothesis that lockdowns have not lowered COVID cases or COVID deaths. It is not necessary to be knowledgeable about science to interpret the data about the effectiveness of lockdowns. The most valid forms of evidence are readily understandable for the layperson.
This article offers three simple reasons why I believe that lockdowns have not had a material impact on SARS-CoV-2 contagion. Check the sources, do your own investigation, and decide for yourself whether or not you think that lockdowns have protected people from coronavirus.
Asymptomatic Spread
All restrictions related to coronavirus are based on the premise that the disease can be spread by people who do not exhibit any symptoms. If contagion was exclusive to symptomatic individuals, there would be no need for any mandates other than ‘Stay home if you feel ill.’ The entire rationale for all of the restrictions, such as staying 2 meters apart from others, avoiding social interaction, and wearing masks, is that anyone, symptoms or no, might have a SARS-CoV-2 infection and pass that infection along to others.
To determine if COVID restrictions decrease contagion, the first question that needs to be answered is ‘How great is the risk of a SARS-CoV-2-infected person with no symptoms passing on his infection to someone?” On the surface, the literature on this subject is mixed. We must emphasize that if asymptomatic spread of coronavirus is uncommon or non-existent, there is no reason for any of the universal COVID restrictions. Thus, if someone wanted to implement or perpetuate COVID restrictions, she would have to convince people that asymptomatic transmission is a very serious problem.
The ‘evidence’ of asymptomatic spread primarily comes from models and inference, not from observational or experimental studies. Models are not science. Any scientist can produce a model which establishes whatever associations between variables her funder wishes to see. The Centers for Disease Control made the bold claim in November 2020 that the majority of SARS-CoV-2 infections resulted from asymptomatic spread.
The CDC offers two sources to back up this claim — a study by Moghadas et al. published in July 2020, and a study by Johanssen, Quandelacy, & Kada et al. that would later be published in January 2021.¹,²
Moghadas’ paper did not involve any observations of actual transmission taking place. It rather used the propaganda technique of producing a scientific-looking model. Their contagion-modelling study was based on transmission rates from a single source: “Temporal dynamics in viral shedding and transmissibility of COVID-19” by Xi He et al.³
Xi He’s study was located in China, the source of the lockdown scam. Considering the fraud and propaganda from Chinese government regarding COVID, no study from China which supports lockdowns can be trusted. Regardless of the place of origin of He’s paper on transmissibility, it is a poor quality study in its own right. Like Moghada’s study, this paper from China is purely speculative, using no observations of transmission of the Wuhan virus. It uses two methods: throat swabs and modelling. The throat swabs were used to infer viral loads using cycle threshold (Ct) results from PCR tests. The study also has a very small sample size of 94 individuals.
It must be noted that He’s study used the same faulty PCR tests to determine viral load as are used to determine if someone has a case of COVID-19. These tests do not have the ability to detect any kind of virus. They only detect RNA fragments. The RNA fragments do not necessarily indicate that a live virus is present in the person, especially at the high cycle threshold (40 cycles) used in the study. A subject may have only have these fragments with no live SARS-CoV-2 virus. To be contagious, or to determine if a SARS-CoV-2 infection is present, a live virus would have to be detected. Ergo, the study from Xi He et al., half the basis for the CDC’s claims of mass asymptomatic contagion, was fraudulent.
The relations between viral load, viral shedding, infection, infectiousness, and duration of infectiousness are not well understood. In a recent systematic review, no study was able to culture live virus from symptomatic participants after the ninth day of illness, despite persistently high viral loads in quantitative PCR diagnostic tests. However, cycle threshold (Ct) values from PCR tests are not direct measures of viral load and are subject to error.
While viral load seems to be similar in people with and without symptoms, the presence of RNA does not necessarily represent transmissible live virus.
Pollock & Lancaster, Asymptomatic Transmission of COVID-19The BMJ, December 20204
Ironically, the CDC itself doesn’t even believe that PCR tests (Ct values) can be used to detect viral transmissibility. On the CDC COVID-19 FAQ page, the question “Can a Ct value predict how infectious an individual with COVID-19 is?” is answered with a resounding ‘no’:
“No. Ct values should not be used to determine a patient’s viral load, how infectious a person may be, or when a person can be released from isolation or quarantine… Thus, a high Ct value could also result from factors not related to the amount of virus in the specimen.”
The other source from which the CDC bases its claim that most SARS-CoV-2 infections result from people without symptoms is a modelling study from Johansson et al. This study is based on the assumption that pre-/asymptomatic SARS-CoV-2 infections are 75% as contagious as symptomatic infections. Johannson provides three sources for the 75% figure:
- A 303-patient cohort study from a quarantined community in South Korea. This study used the same cycle threshold (Ct) values from PCR tests as Xi He’s study. It found that Ct values were similar among symptomatic and asymptomatic individuals. In the study, no inferences about the contagiousness of asymptomatic individuals were made, however.5
- An observational study from Brunei of 71 infected individuals. This study determined that attack rates for asymptomatic/pre-symptomatic individuals are 30/42% of symptomatic individuals, respectively.6
- Rapid review of existing studies on asymptomatic transmission. Assessed 6 of the 18 studies identified: 4 modelling studies (all from China) and 2 contact-tracing studies (one from China, one from Italy). The Italian contact tracing study had only 8 subjects. This review suggested that asymptomatic infections are 40-70% as infectious as symptomatic infections.7
CDC’s Johannson et al. source for asymptomatic transmission is no more credible than the Moghadas study. The authors state that they use a “simple model” and presumed that asymptomatic cases were three quarters as infectious as symptomatic cases. The assumption was based on three studies which, in turn, were primarily based upon modelling studies using Ct values based in China. Only two observational studies outside of China were included for a total of 79 subjects, too small a sample to produce statistically significant results.
The Brunei observational study has been criticized for its methodology. Of the 5 people that supposedly caught SARS-CoV-2 from an asymptomatic carrier, two had no symptoms, and the other three had symptoms lasting 1, 2 and 4 days, respectively. The subjects with symptoms had only one symptom each which quickly resolved including a mild cough and runny nose. Considering the extremely high false positive rate of PCR tests and low level of symptoms observed in the study, it is possible that none of these five subjects even had SARS-CoV-2.28
Two of Johannson’s three sources for the 75% degree of infectiousness assumption cautioned that their respective studies were not fit to determine infectiousness. The Korean study stated “It is important to note that detection of viral RNA does not equate infectious virus being present and transmissible. For a better understanding of the viral shedding and potential transmissibility of asymptomatic infection, large rigorous epidemiologic and experimental studies are needed.”
The rapid review report cited by Johannson is not peer-reviewed and the study itself advised against its use in policy: “This article is a preprint and has not been peer-reviewed. It reports new medical research that has yet to be evaluated and so should not be used to guide clinical practice.” It evens cautions about the quality of studies it reviewed: “Several of the studies reviewed are in pre-print stage and are not peer-reviewed.”
The authors of the rapid review further explained why public policy should not stem from their report: “viral load is not directly relatable to infectiousness of the individual… It must be stressed that this suggestion comes from a very low evidence base and that estimates exist that are close to zero and close to 1.”
Both of the sources cited by the CDC to back its claim for the majority of SARS-CoV-2 contagion being asymptomatic are based upon modelling studies from China, which could have been influenced by the CCP and cycle threshold counts, a practice from which it is impossible to assess if a virus is present, yet alone the contagiousness of someone infected with a virus.
We can confidently dismiss any studies supporting the theory of asymptomatic SARS-CoV-2 transmission which are based upon flamboyant modelling or tenuous inference. Those methods are more propaganda than science. Only real-world research should be considered to answer the question ‘Can asymptomatic transmission affect the course of SARS-CoV-2 in society?’
Observational Studies of Transmission
Due to the theoretical and highly corruptible nature of modelling studies, only observational studies should be used to determine the extent of asymptomatic transmission. The largest of these is probably the metastudy of household transmission published in JAMA, December 2020 by Madewell, Yang, and Longini.8 This study examined 54 individual studies of household transmission. It found that individuals living in the same home as a SARS-CoV-2-infected person with no symptoms became infected in 0.7% of the cases. Individuals living with someone with an actual COVID-19 illness became infected in 18% of the cases, a 28-fold increase. The study included pre-symptomatic individuals.
It is important to differentiate between “asymptomatic” and “pre-symptomatic” SARS-CoV-2 infections. Asymptomatic refers to people who are infected but never experience any symptoms. This accounts for approximately half of SARS-CoV-2 infections. “Pre-symptomatic” refers to people in the period between becoming infected and exhibiting symptoms of COVID. On average, it takes 5 days before a person infected with SARS-CoV-2 develops symptoms.9
There is strong evidence that people who never develop symptoms from a SARS-CoV-2 (or other respiratory) infection, have very little ability to infect others. Below is a video in which Anthony Fauci states that asymptomatic infections are never the driver of respiratory pandemics.
In a June 2020 press conference, WHO’s technical lead for COVID-19, Dr. Maria Van Kerkhove, explained that countries around the world reported transmission of SARS-CoV-2 by asymptomatic individuals as a “very rare” event. See video below.
Matt Hancock, UK Secretary of Health, spills the beans on asymptomatic transmission.
We may conclude, therefore, that there is very little contagion of SARS-CoV-2 among people who have asymptomatic infections. However, the contagiousness of people during the pre-symptomatic phase of COVID-19 needs to be assessed separately. As with Moghadas’ asymptomatic transmission study, the only evidence of pre-symptomatic transmission of SARS-CoV-2 comes from China. In a systematic review of the evidence for pre-symptomatic SARS-CoV-2 contagion by Qiu et al. published in the journal Clinical Microbiology and Infection in April 2021, subjects were found to be equally contagious in the pre-symptomatic and symptomatic stages of COVID.10 However, almost all of the studies on pre-symptomatic contagion that Qiu’s team analyzed came from China, an untrustworthy source considering that lockdowns are a scam concocted by the CCP.
Michael Yeadon, former VP and chief scientist in the Respiratory division at Pfizer, unequivocally states that asymptomatic transmission of SARS-CoV-2 is not possible. “The first time the notion of “asymptomatic transmission” was mentioned, I smelled a rat. Not saying it’s never happened once, but as an important contribution to transmission? No. To be a source, you need lots of virus in your airway. But once that happens, you will be symptomatic, either because the virus is injuring your lung lining (epithelium) or because you’re fighting it off (or both). You can’t be both a virulent source and not have symptoms.”11
Dr. Michael Yeadon, former VP/Chief Scientist, Respiratory Division, Pfizer
Dr. Sucharit Bhakdi, most-cited German microbiologist
Dr. Wolfgang Wodarg, former chief of health, Council of Europe
Clips taken from interviews at PlanetLockdownFilm.com
Yeadon destroys the asymptomatic spread myth (16:00 – 26:00)
The CDC has been sowing misinformation about asymptomatic spread for the flu (influenza), as well. They state on their website that the flu is spread asymptomatically, a theory not well supported by evidence.12 A 2009 literature review by Patrozou & Mermel of the evidence for pre-symptomatic and asymptomatic transmission of the flu found that there basically was no evidence.
“Infectiousness has been inferred based on the presence of influenza in the upper respiratory tract rather than from transmission experiments. Although asymptomatic individuals may shed influenza virus, studies have not determined if such people effectively transmit influenza. We performed a systematic review of published studies describing the relationship between viral shedding and disease transmission. Based on the available literature, we found that there is scant, if any, evidence that asymptomatic or presymptomatic individuals play an important role in influenza transmission.”13
Macfarlane and Lim state that infection control of pandemic flu would be challenging because “unlike SARS, flu is highly infectious before patients develop definite symptoms.”
What is the evidence for asymptomatic transmission of flu? Fraser et al describe a model for the spread of flu, but it is only a mathematical model for transmission and the paper does not provide any convincing references to support asymptomatic spread. Older work by R B Couch in the 1970s states that viral shedding may sometimes occur before clinically significant symptoms, but viral shedding detected by nasal swabs cannot be equated to transmission of infection. Infected airway mucus must be exchanged for flu to transmit from one person to another.
Rhinorrhoea, coughing, and sneezing are important factors in facilitating aerosol and fomites transmission of infection, and I doubt that any clinically significant exchange of airway mucus can occur from asymptomatic cases of flu.14
Ron Eccles, former director of the Common Cold Centre at Cardiff University
BMJ, 2005
SARS-CoV-2 is 80% identical to SARS (aka SARS-CoV-1) of 2003. People who were exposed to the original SARS have been found to be immune to SARS-CoV-2 seventeen years later.15 Comparison of infectiousness between SARS-CoV-1 and SARS-CoV-2 is therefore reasonable.
SARS is universally considered to be contagious only when symptoms are present. Zeng et al. published a paper on the infectivity of SARS in the pre-symptomatic phase in the Journal of Biomedical and Environmental Sciences in 2009.16 Of the 363 subjects who had contact with pre-symptomatic individuals infected with SARS, there was not a single infection. Zeng concluded “SARS cases are infectious only during their symptomatic period and are non-infectious during the incubation period.”
The evidence that the COVID-19 pandemic is significantly affected by pre-/asymptomatic transmission is paper thin. The CDC has been aggressively promulgating this myth, along with the myth that the flu is spread by people without symptoms.
Shutting down society and committing deplorable crimes against humanity is hardly justified based on speculation and modelling. Lockdowns and other lifestyle restrictions are predicated on the notion that asymptomatic contagion of SARS-CoV-2 is very common. The only data which support that theory are theoretical speculative studies with roots in China.
Trend Analysis
A thorough analysis of COVID trends can give us a fairly accurate picture of the effectiveness of COVID restrictions. If an effective COVID mitigation policy is administered, it should be apparent from looking at time series trends of COVID infections, hospitalizations, and deaths across multiple locations.
A number of studies have looked at the effect that COVID restrictions have had on COVID trends. These studies are of three types, which may not be mutually exclusive. One type compares the actual trend to a projected trend. Not surprisingly, this type varies considerably in its assessment of pandemic policy effectiveness depending on what the researchers believed would have occurred in the absence of restrictions. Comparisons between projected and actual trends are always vulnerable to bias and corruption.
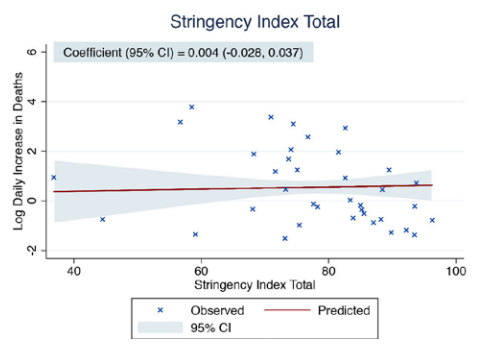
The second type of trend analysis simply looks for correlations between restrictions and COVID metrics in a state. Did new daily COVID cases decrease after a lockdown was implemented? Did deaths from COVID decrease following mask mandates? Researchers recognize that there may be a lag of two to four weeks before the effects of a policy become apparent on the trends.
A limitation of this type of trend analysis is that it cannot tell you why variations in metrics occur. Many politicians have claimed victory that lockdowns worked if COVID metrics improved after the initiation of the new restrictions. However, B following A does not prove anything about A. For instance, a reduction in COVID cases during a lockdown may not be due to the lockdown but to other variables such as seasonality or increased immunity in the population. The claim that an event necessarily caused a subsequent event simply because it occurred earlier is called the ‘post hoc ergo propter hoc’ fallacy, or ‘post hoc’ fallacy, for short.
The power of time series analysis is its ability to determine the degree of correlation across a sample of states. A single graph showing that the trend of COVID cases has bended downwards three weeks following a new restriction, for instance, would be insufficient to establish a correlation. However, an analysis of a number of states, each having increased and decreased restrictions several times, could be very useful. If COVID case trends pushed downward or upward within a month, respectively, in each state, there would be compelling evidence that cases were correlated with the stringency of restrictions. Unless the states changed the severity of the restrictions at the similar times. In that case, changes to the trends could be due to seasonality or expected outbreak patterns.
The final category of trend (and correlational) analysis, and the one that has the most potential to assess lockdown effectiveness, is the comparison of highly restricted states with moderately or non-restricted states. This type of analysis avoids the risk of trumped up models and the post hoc fallacy. It does not eliminate confounding variables, however.
For example, by looking at two countries with similar COVID trends, one locked down and one free, it cannot be definitively stated that the lockdown had no effect because it is still possible that COVID metrics could have been worse if there were no restrictions. Possible does not mean likely, it just means possible. However, the larger the sample size, the higher the confidence level that the independent variable (restrictions) are the cause of the dependent variables (COVID metrics).
Below, we will briefly examine the effectiveness of lockdowns using time series analysis and comparitive analysis of trends and restriction-metrics correlations.
Time Series
A number of studies have looked at the effect that lockdowns have had on daily numbers for new COVID cases and deaths, and overall deaths. These are more valid metrics than all-cause deaths because ‘excess mortality’ is expected to rise due to the restrictions themselves. The stress, misery, and loneliness of lockdowns has undoubtedly taken the lives of many elders.
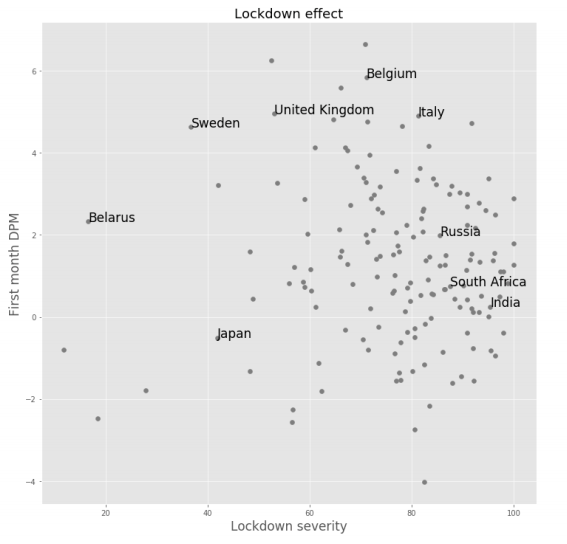
A study by Thomas Meunier of Western Europe after the first month of lockdown has found that the lockdown did not affect contagion:
“Comparing the trajectory of the epidemic before and after the lockdown, we find no evidence of any discontinuity in the growth rate, doubling time, and reproduction number trends. Extrapolating pre-lockdown growth rate trends, we provide estimates of the death toll in the absence of any lockdown policies, and show that these strategies might not have saved any life in western Europe. We also show that neighboring countries applying less restrictive social distancing measures (as opposed to police-enforced home containment) experience a very similar time evolution of the epidemic.”17
Researchers at Munich University conducted a study on Germany’s lockdown in June 2021 and concluded that it did not affect COVID rates.
A University of East Anglia study had a similar conclusion: “Widespread closure of all non-essential businesses and stay at home orders seem not to have had much if any value.”18
Pandemics Data & Analytics released a report in November 2020 which did not find any effect that lockdowns have had upon trends of COVID cases in 146 countries, nor any correlation between countries that were open compared to being locked down.
“Lockdowns do not appear to reduce deaths or flatten epidemic curves in any way. We suspect that the survival of the perception that they do is a result of the belief that initial epidemiological modelling, which failed to take into account, inter alia, the factors presented in this article, was accurate. This creates a sense that the difference between modelled and actual experience is owing to lockdown, when instead it is owing to model error.”19
Don’t take the word of researchers. Look at COVID graphs yourself and see what effect, if any, violations of freedoms have had on the course of the pandemic. Locate the graph of your state online and see what effect lockdowns, mask mandates, and other freedom violations have had on the COVID trends. Note that a decrease in cases is not necessarily due to restrictions. There could be other reasons for it, such as the inherent waves of pandemics. That is why comparing between countries is essential.
The trend of daily COVID cases in California below does not appear to show that shelter-in-place orders have had any impact.
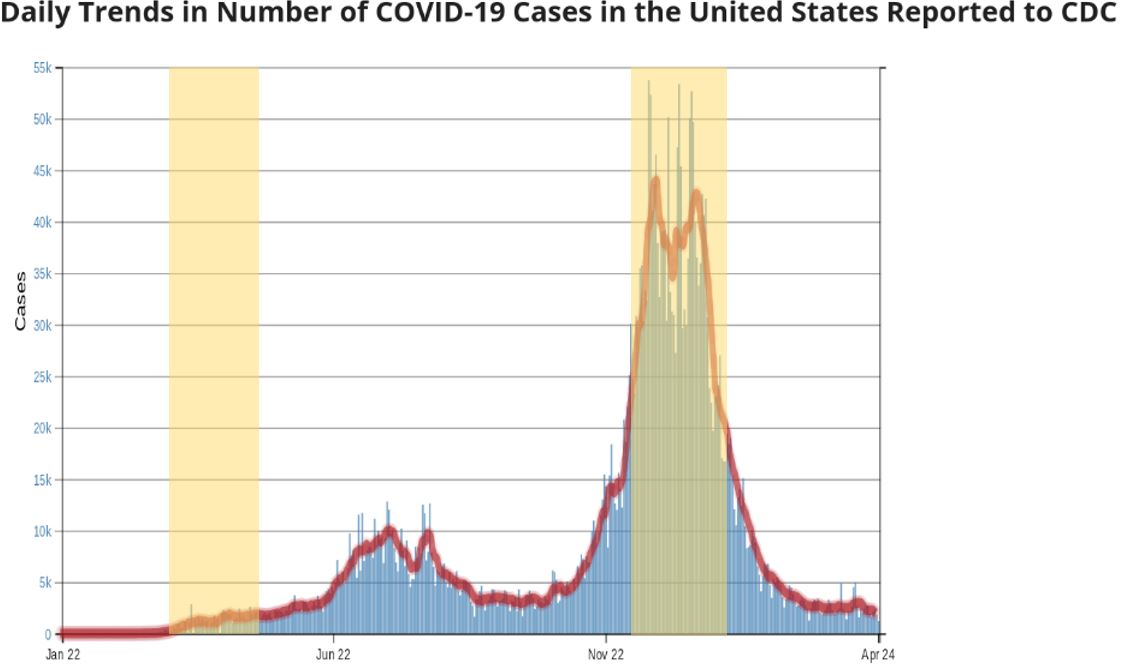
California’s two statewide stay-at-home order periods are highlighted.
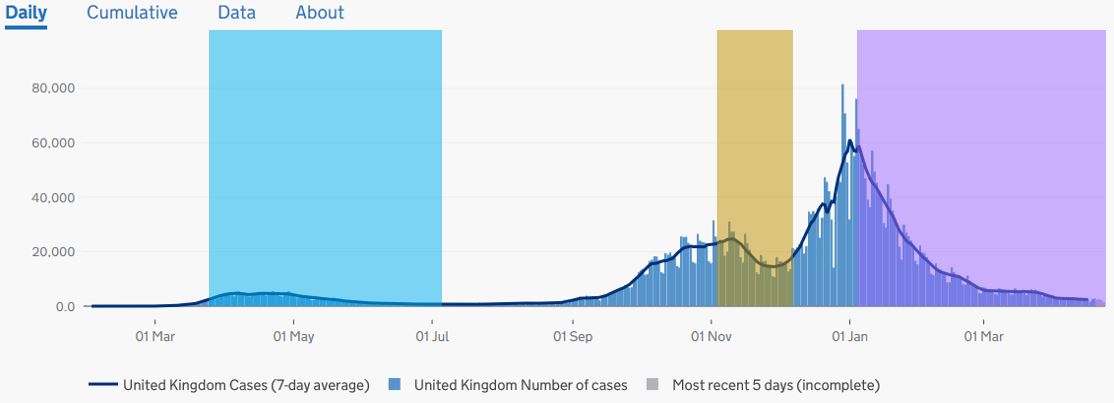
The graph below showing England’s three national lockdowns appears to demonstrate that the last two lockdowns significantly decreased contagion. Cases were relatively flat during the first lockdown. Cases trended down for half of the second lockdown and all of the third. Furthermore, cases rose significantly after the second lockdown was eased. Boris Johnson claims that the lockdowns have been very effective at stemming the spread.
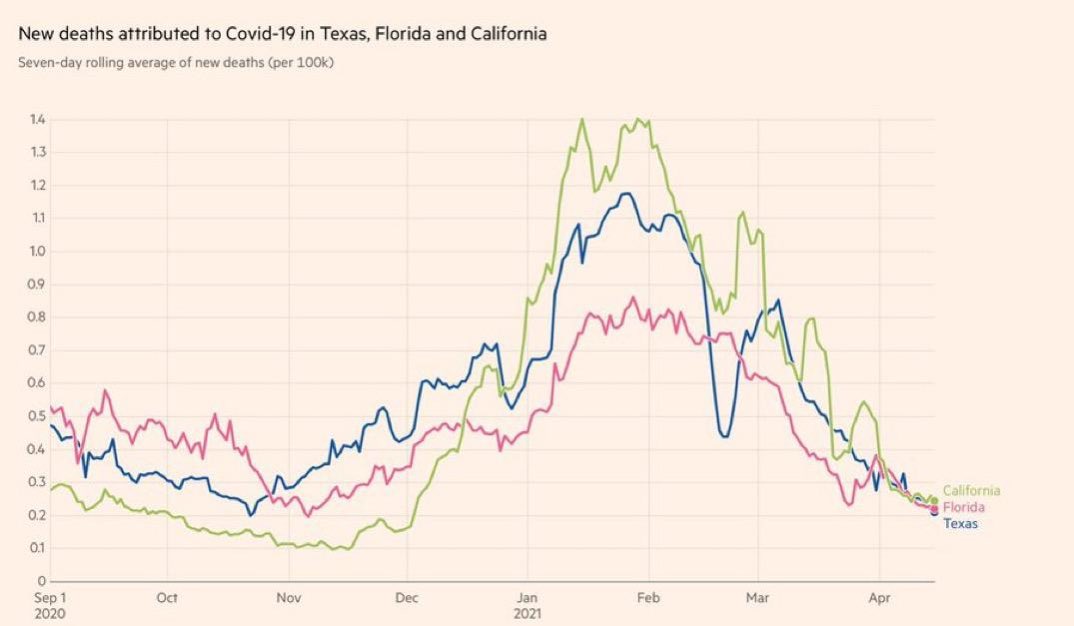
Florida: 9 months without restrictions. Texas: 2 months without restrictions. California: heavy restrictions throughout graph duration.
By looking at COVID trends around the world, we can see that the pattern of UK’s daily cases was similar in other countries, regardless of their level of restrictions. Florida ceased all COVID restrictions in late September 2020 yet followed a similar pattern to Britain. Florida’s cases also peaked in January 2021 then fell sharply. The state also had a first wave smaller than the winter wave, although it occurred three months earlier.
Check out the COVID trend tool on Our World in Data to get graphic information for any country. The CDC has a user-friendly graphing tool for U.S. national and state COVID metrics, as does the UK. Because the UK’s pandemic course has mimicked that of countries with lower levels of restrictions, or different lockdown timelines, the reduction of cases during England’s lockdowns appears to be due to factors other than the lockdown.
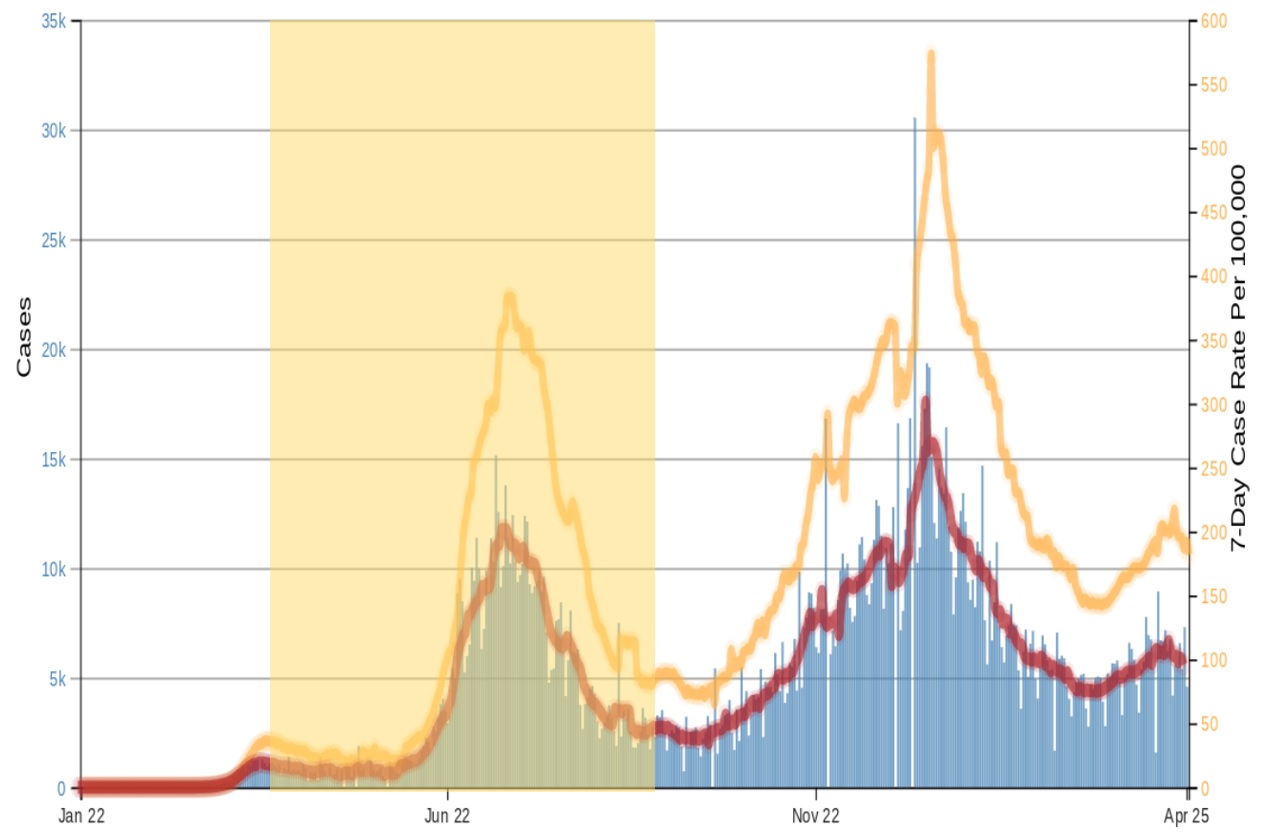
Florida COVID cases – absolute and per million population. Restrictions in place April 4 to Sept. 24, 2020 shown highlighted.
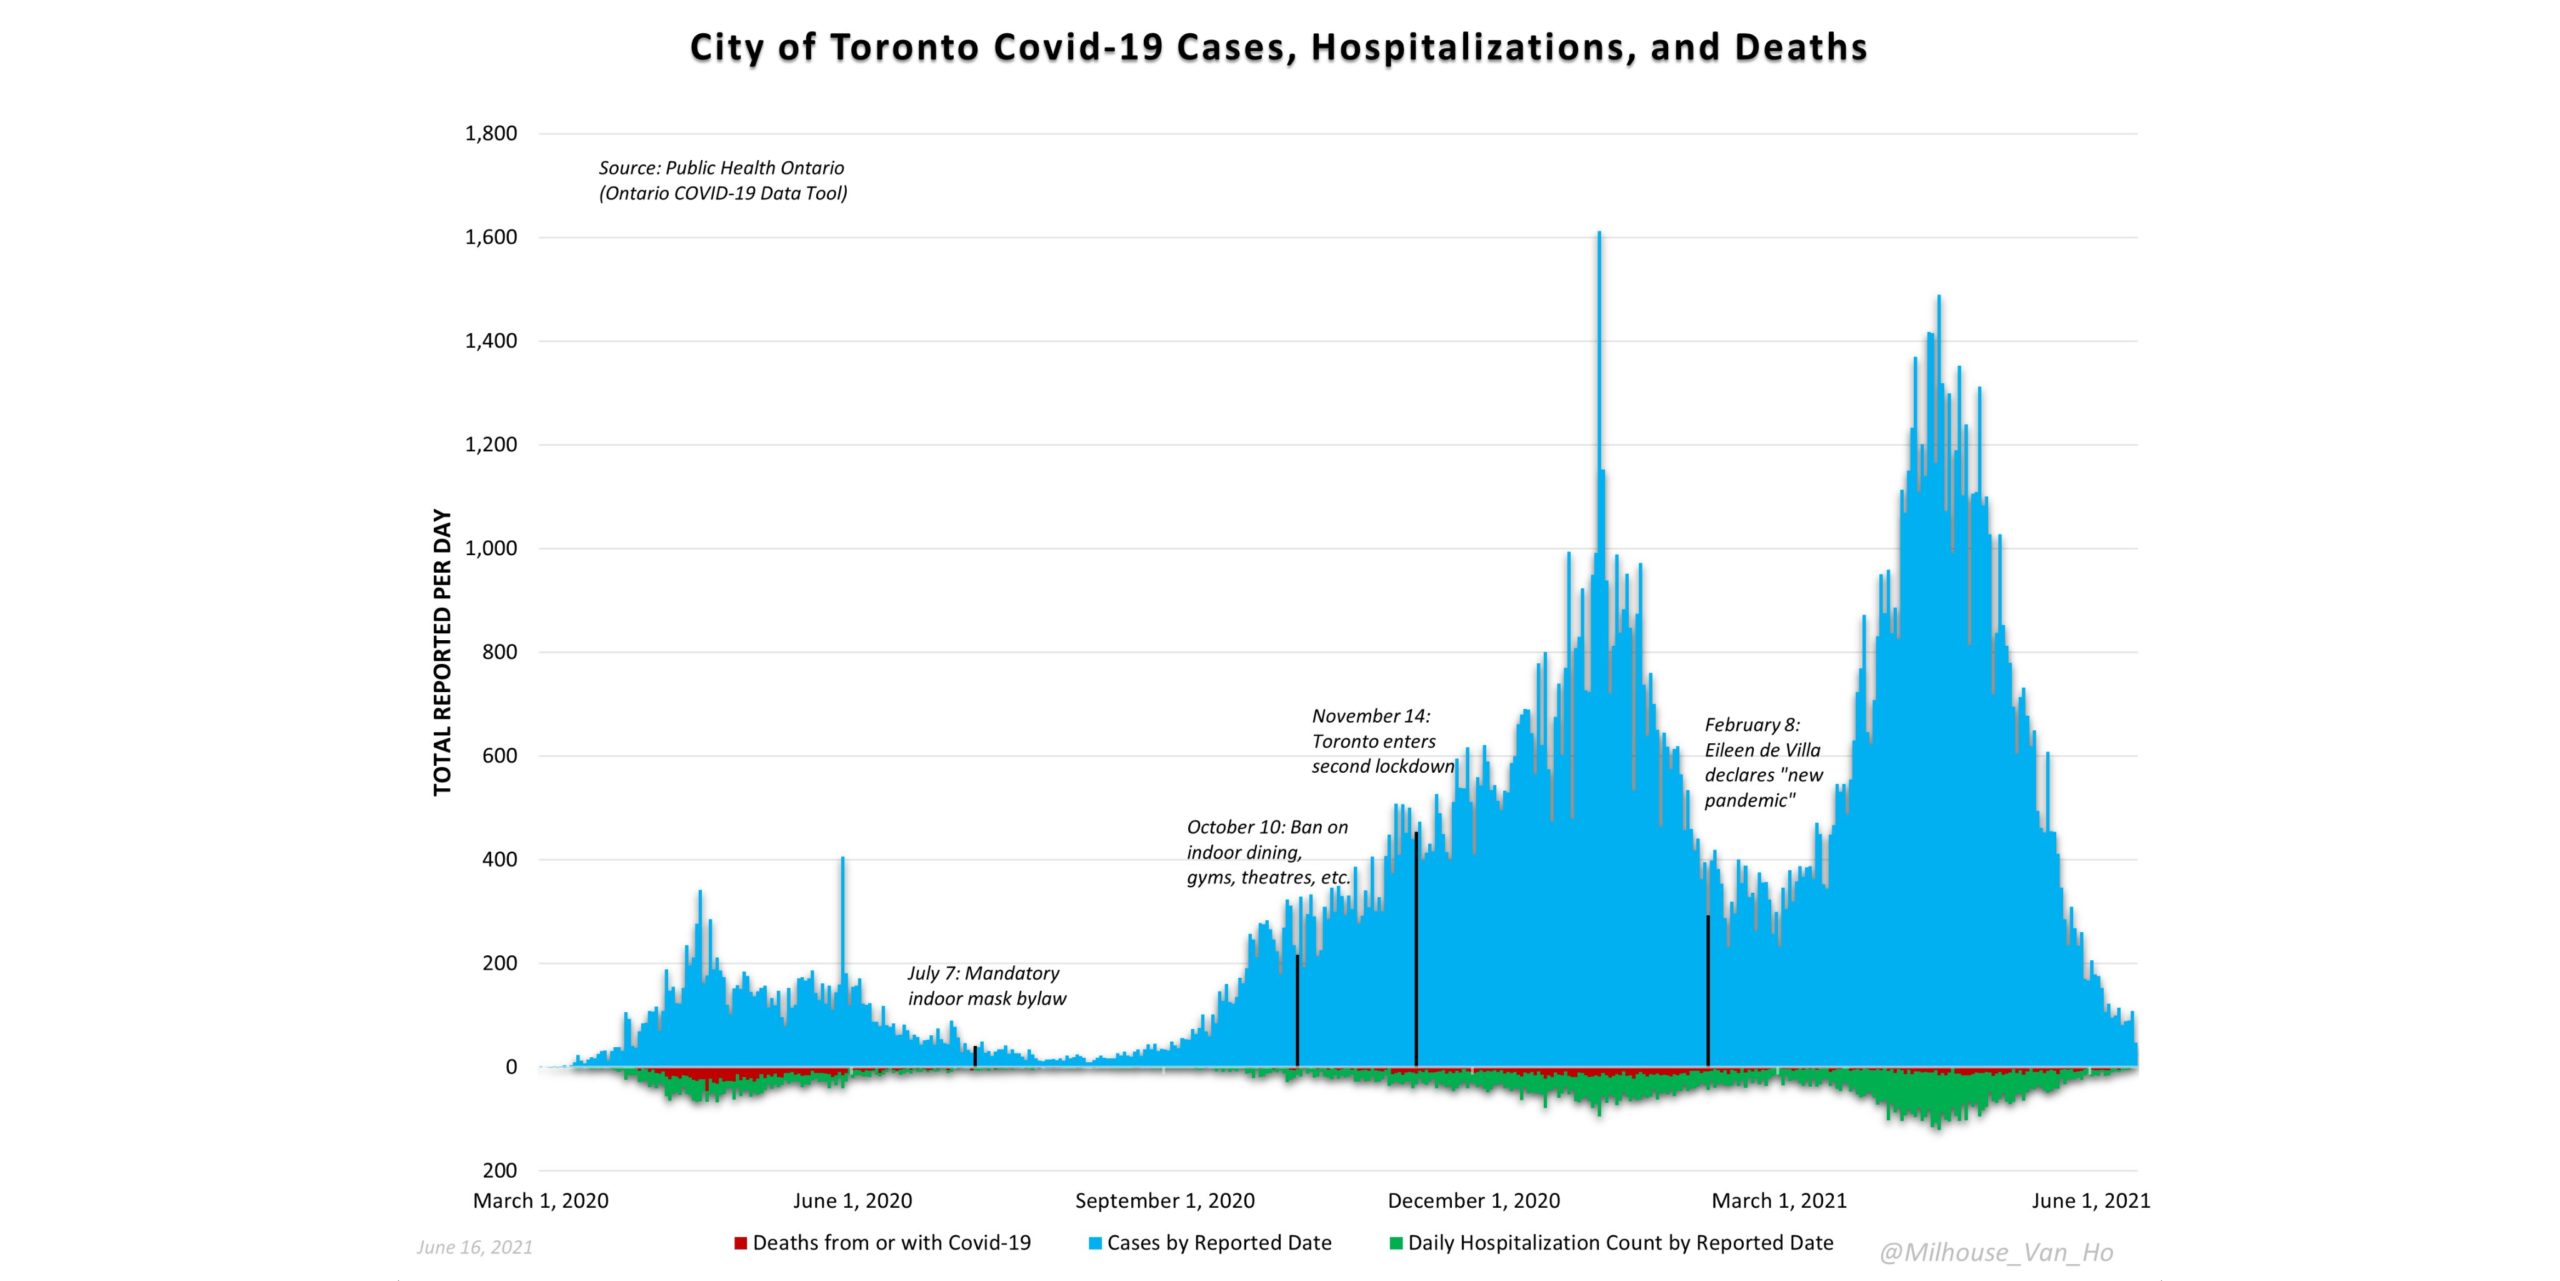
Toronto: no correlation between restrictions and metrics.
Inter-State Correlation of Stringency and COVID
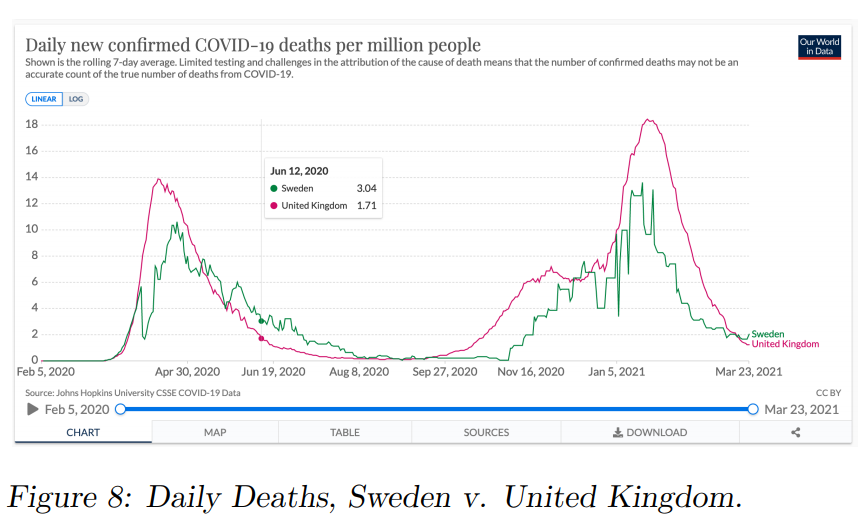
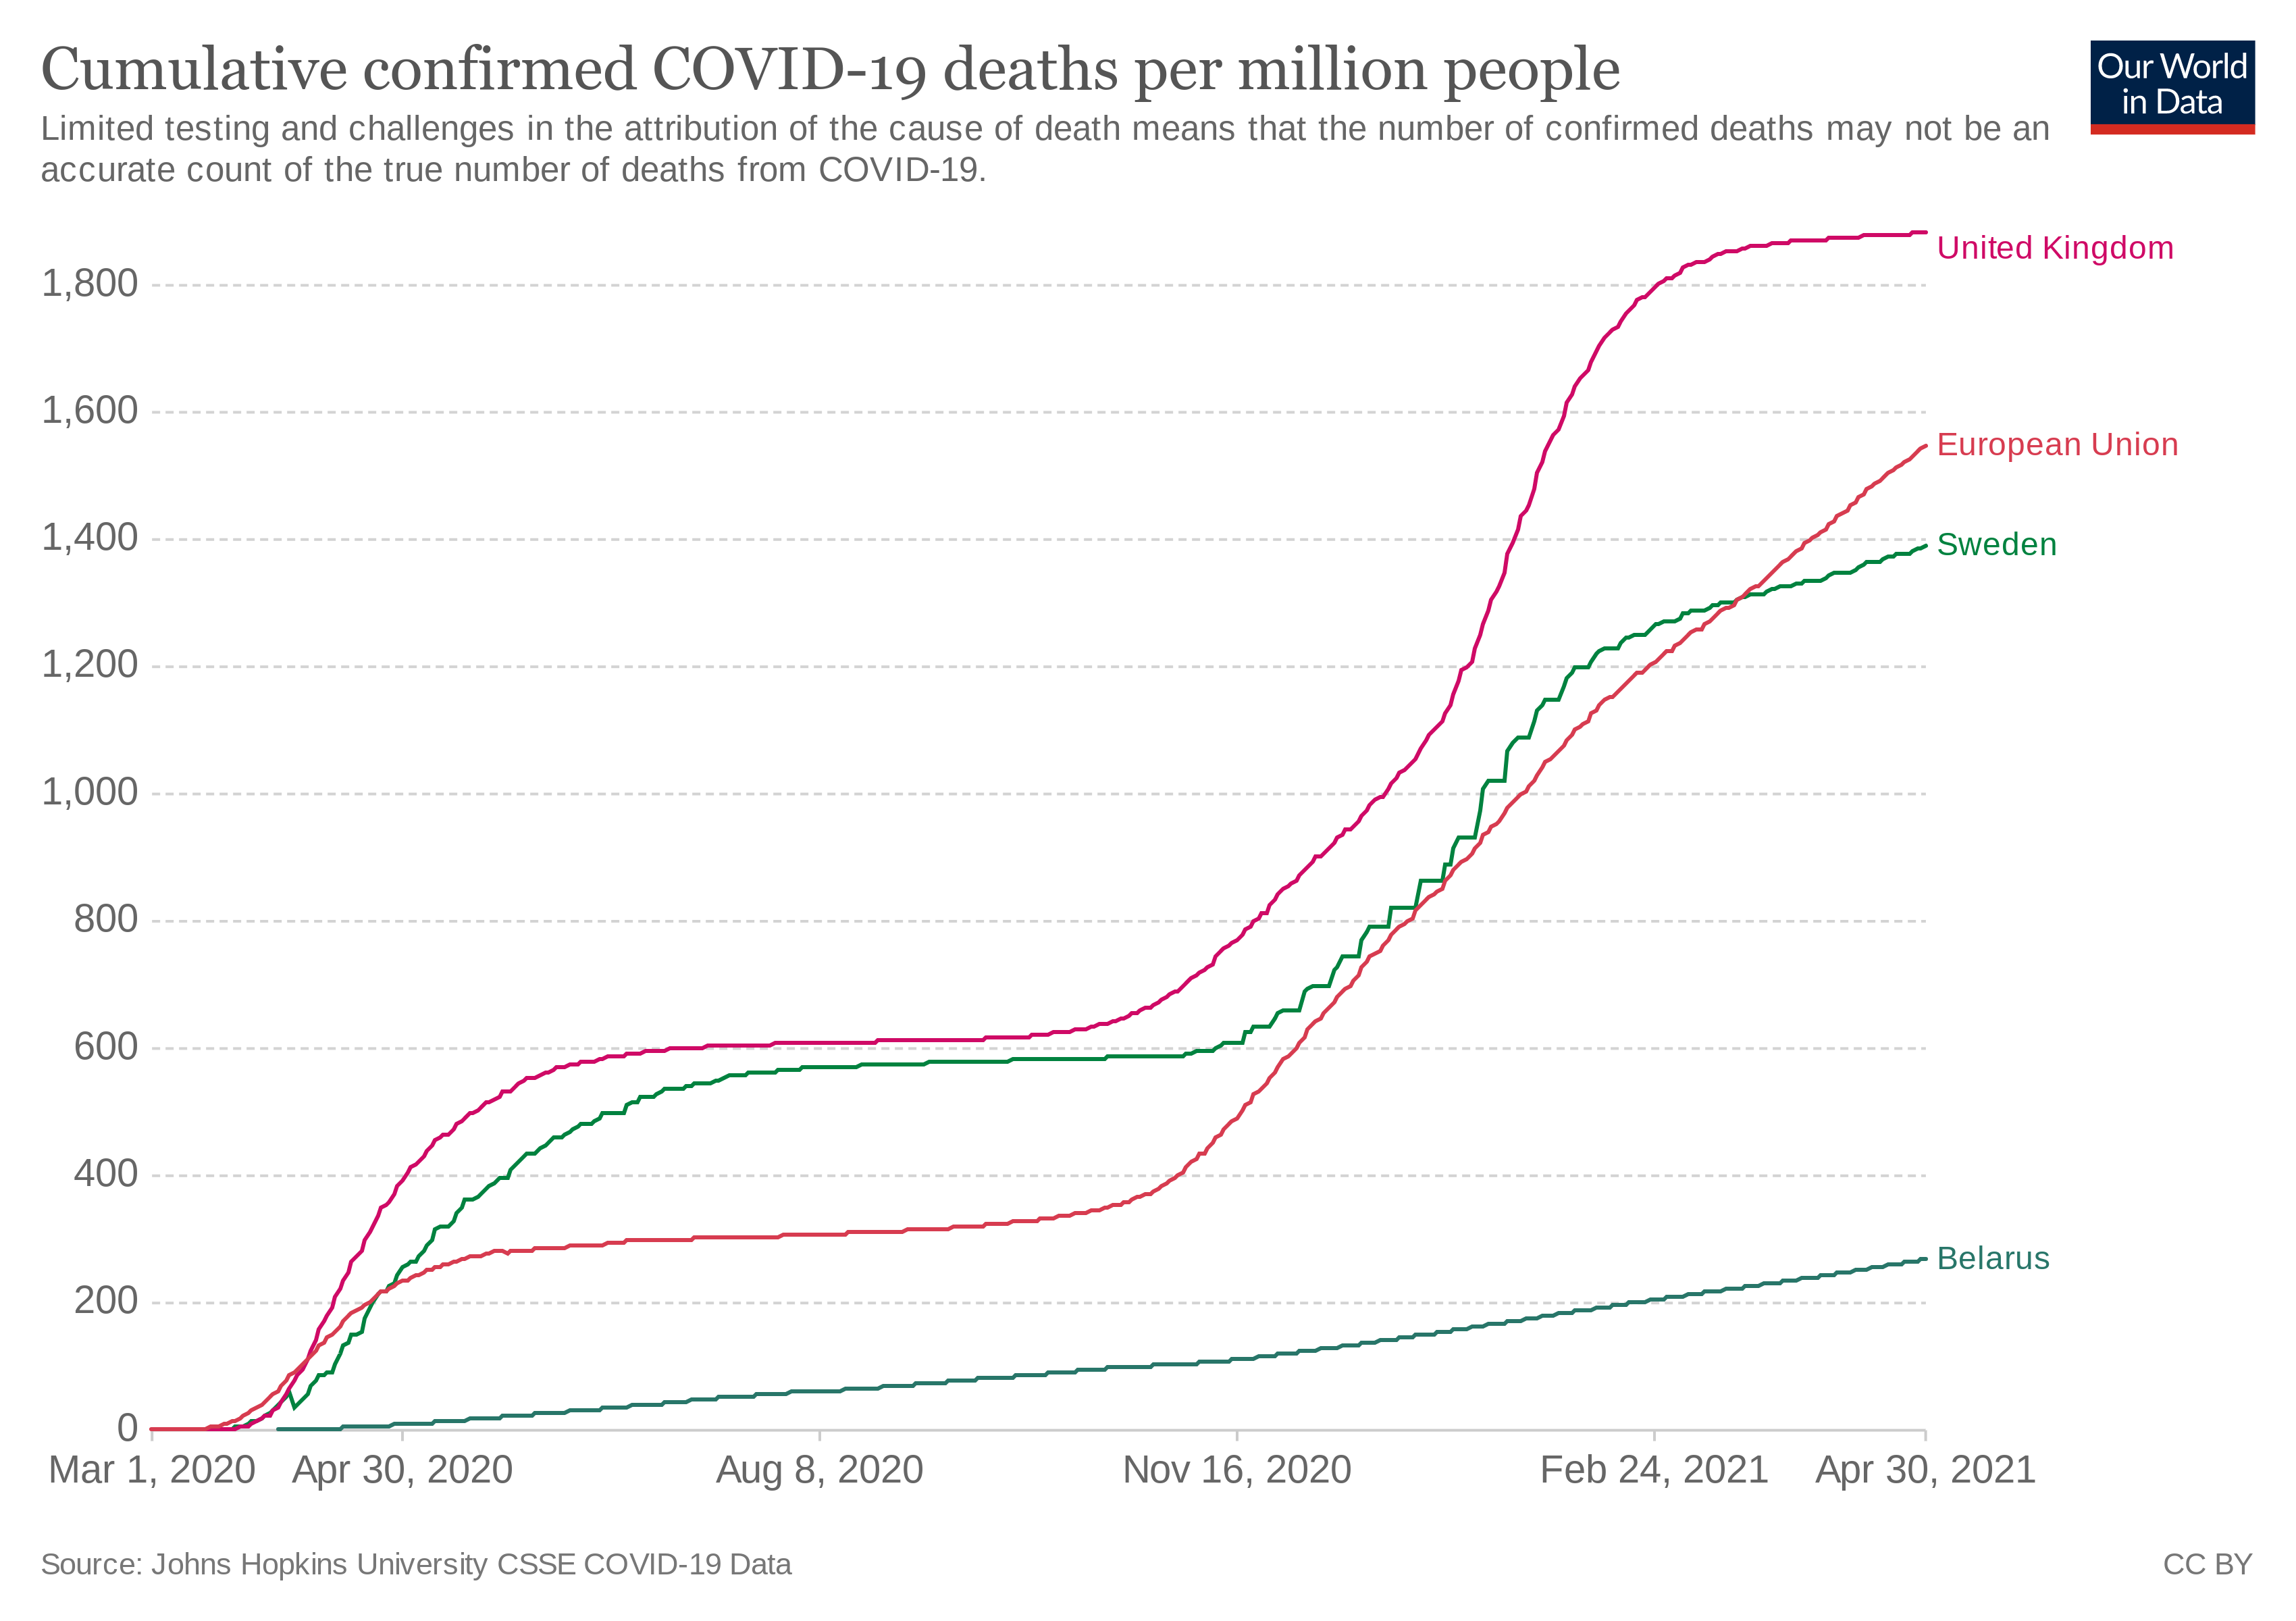
Many researchers have examined trends of COVID cases and deaths for a large sample of states and found no correlation between stricter pandemic responses and lower cases. Sweden has done better than the average of Western nations in all COVID metrics, despite being the only one with no lockdown (along with Belarus). In the most important COVID metric, cumulative confirmed deaths with COVID per million people, Sweden has done better than its heavily restricted European neighbors. As of April 2021, Sweden has 1,378 COVID deaths/million. The European countries that had severe lockdowns, UK (1,880), Italy (1,972), Spain (1,659), and France (1,511), did considerably worse.20
Belarus also stayed open and has one of the lowest rates of SARS-CoV-2 infections in Europe. It has the third lowest COVID deaths per million in Europe at 267. Low income countries, which have had little to no restrictions, have fared immensely better than wealthier nations by all accounts.20
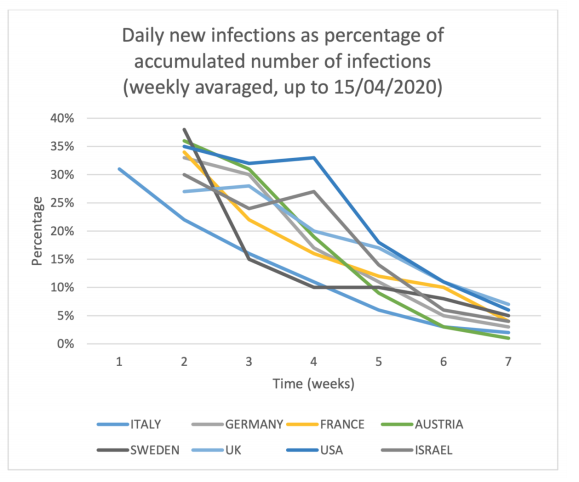
After eight weeks of lockdown in Israel, Israeli scientist, Isaac Ben-Israel, examined the pattern of SARS-CoV-2 infections around the world and noted that more restricted countries were not faring better.
It turns out that a similar pattern – rapid increase in infections that reaches a peak in the sixth week and declines from the eighth week – is common to all countries in which the disease was discovered, regardless of their response policies: some imposed a severe and immediate lockdown that included not only “social distancing” and banning crowding, but also shutout of economy (like Israel); some “ignored” the infection and continued almost a normal life (such as Taiwan, Korea or Sweden), and some initially adopted a lenient policy but soon reversed to a complete lockdown (such as Italy or the State of New York). Nonetheless, the data shows similar time constants amongst all these countries in regard to the initial rapid growth and the decline of the disease.21
Isaac Ben-Israel
A paper published in the Journal of Behavioral Economics for Policy determined “Locking down the economy does not appear to be a necessary condition for collapsing the growth of Covid-19 related death rates in ‘good’ time. This collapse in growth rates occurs in all of our sample countries irrespective of how severe or lax their lockdown policies are.”22
A June 2020 study by John Gibson at New Zealand’s University of Waikato looked at the variation of COVID metrics at the county level within the United States and New Zealand.23 According to Gibson, “Variation amongst counties in the United States, where over one-fifth had no lockdown, shows no impact from lockdowns.” He sees a similar phenomenon in New Zealand, “So the firmest conclusion is, that over the ten weeks since New Zealand’s March 23 lockdown decision, there is no evidence of more Covid-19 deaths in places that had no lockdown.”
In December 2020, Kepp & Bjornskov performed a comparative study of counties in northern Denmark.24 Some of the counties were open. Some were locked down. The researchers found that the existence of a lockdown made no difference to pandemic outcomes. “In our own analysis of this dataset, which we invite others to investigate, we did not find evidence of any effects of the lockdown on the development of infection rates across Northern Jutland, relative to the control. In other words, we find that an extreme version of societal lockdown had no effect on virus development.” This study is particularly useful because it essentially had a ‘control group’ in the same geographic location and the researchers thought there was scant potential for confounding variables.
Bendavid et al. at Stanford University published an analysis on lockdown effectiveness. The researchers found no benefit of ‘more restrictive non-pharmaceutical interventions’ (mrNPI) over ‘less restrictive non-pharmaceutical interventions’ (lrNPI).
In the framework of this analysis, there is no evidence that more restrictive nonpharmaceutical interventions (“lockdowns”) contributed substantially to bending the curve of new cases in England, France, Germany, Iran, Italy, the Netherlands, Spain, or the United States in early 2020. By comparing the effectiveness of NPIs on case growth rates in countries that implemented more restrictive measures with those that implemented less restrictive measures, the evidence points away from indicating that mrNPIs provided additional meaningful benefit above and beyond lrNPIs.25
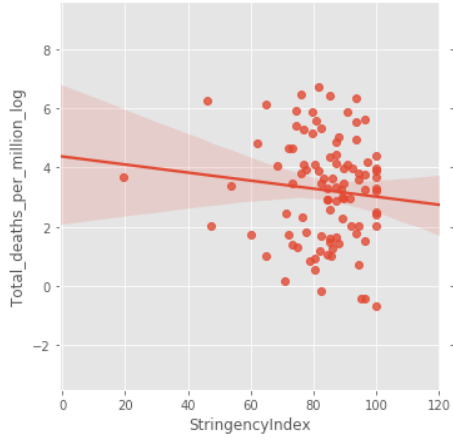
Larochelabert et al., in Frontiers of Public Health in November 2020: “Regarding government’s actions (i.e., containment and stringency index), no association was found with the outcome, suggesting that the other studied factors were more important in the Covid-19 mortality than political measures implemented to fight the virus, except for the economic support index.”26
Pana et al. looked at the rate of increase in COVID-19 mortality in 37 countries in the first wave. Closure of international borders was found to have a considerable impact. The stringency of domestic restrictions, however, did not affect the rate of change in mortality.27
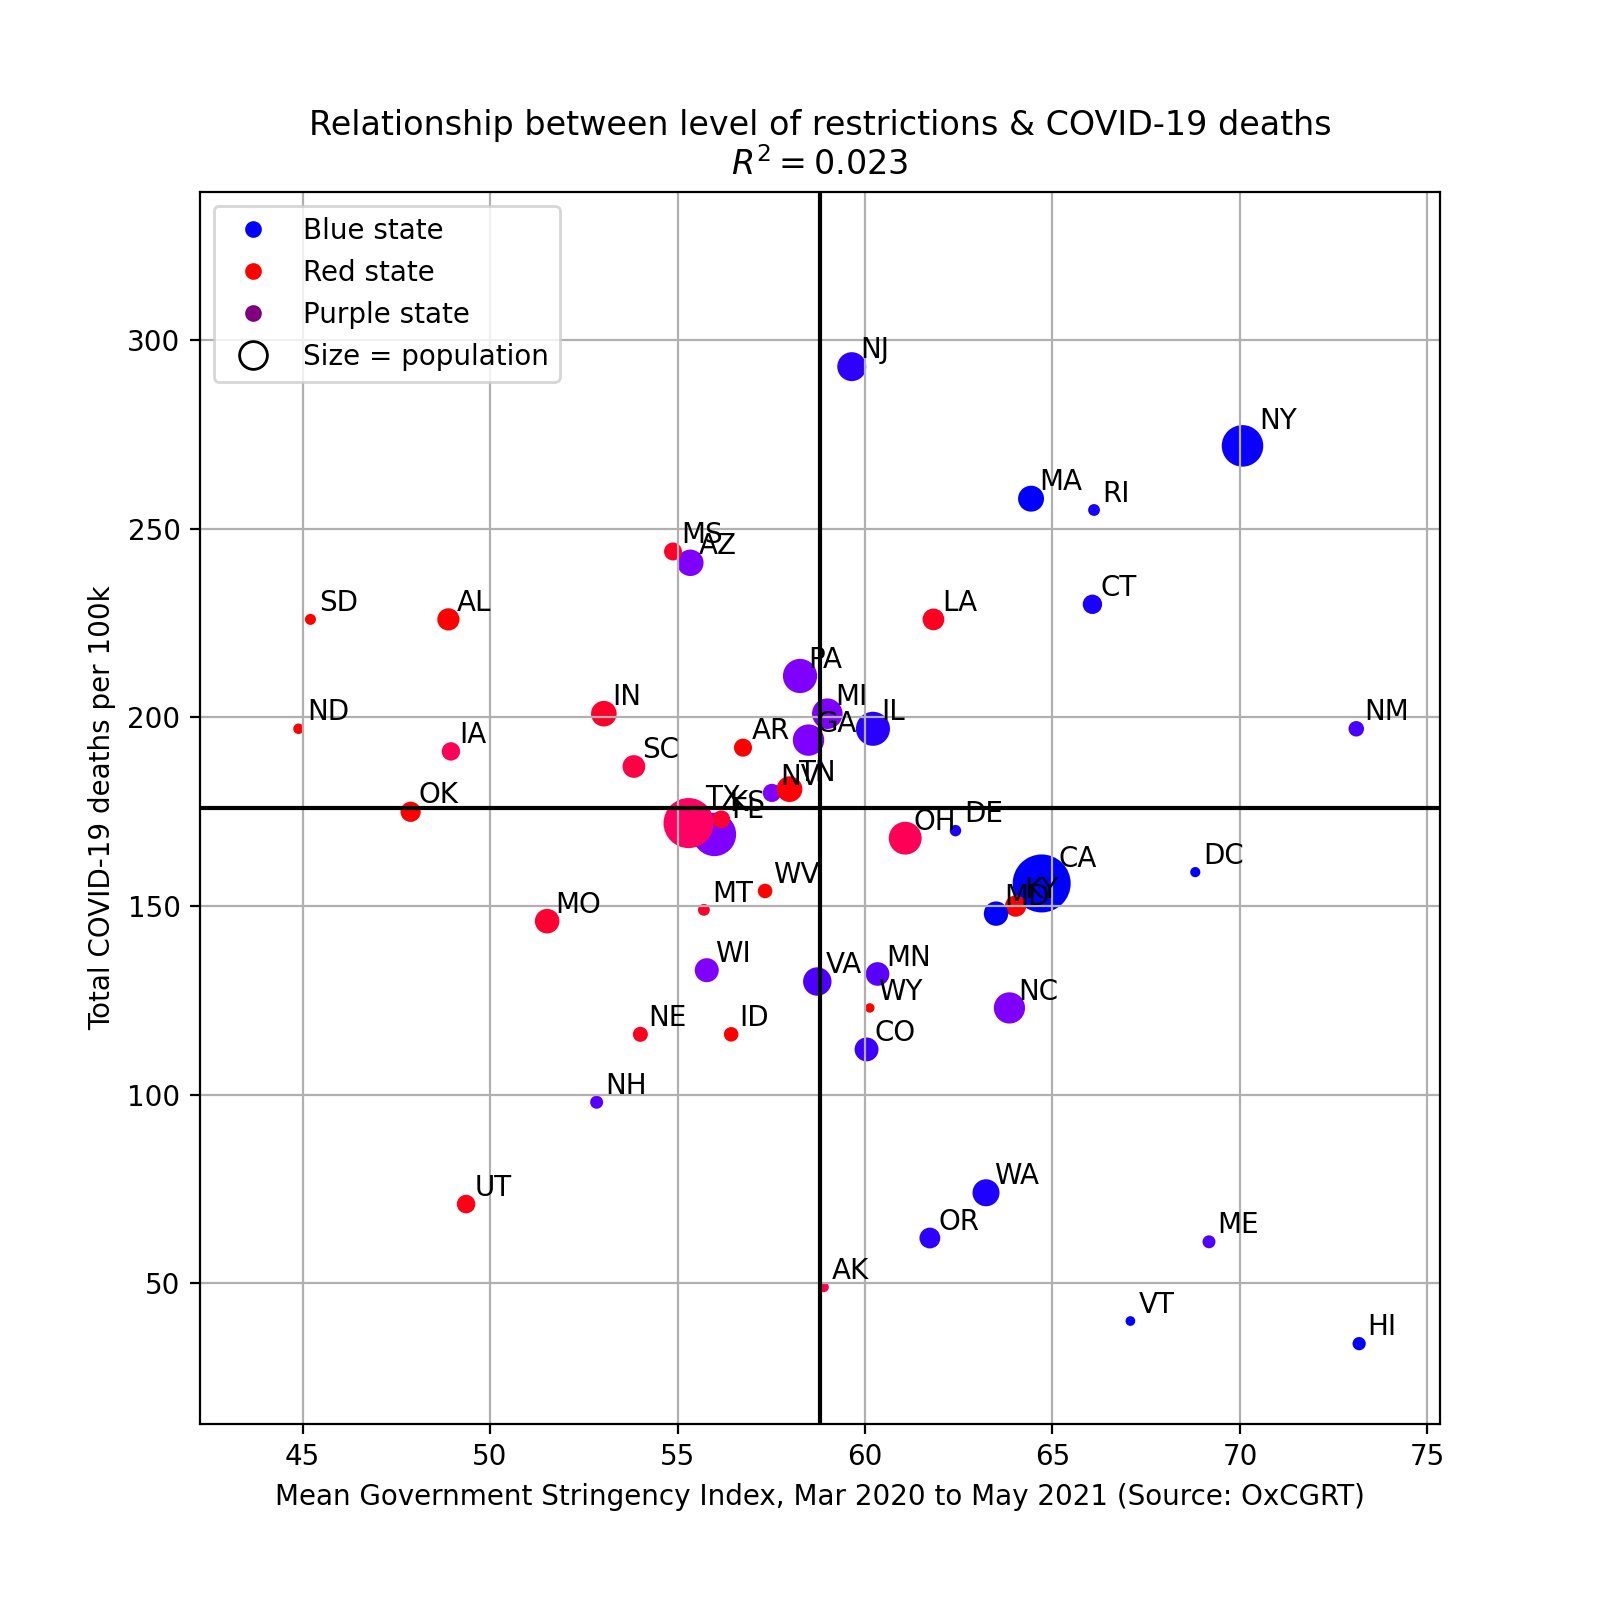
MIT data scientist Youyang Gu analyzed U.S. states for effectiveness of lockdowns in May 2021. He found no correlation between between the intensity of restrictions and deaths from COVID-19. Below is a graph from his analysis.
Why Don’t Lockdowns Slow the Spread of SARS-CoV-2?
It is intuitive to expect that lockdowns would make coronavirus cases plummet but the data does not support that theory. The studies which have found that lockdowns decrease contagion are of two types. Those that compare actual data to inflated models of contagion and those that presume that whatever happens following an event of interest must be due to that event (post hoc fallacy).
All of the quality studies that have attempted to find evidence for lockdown effectiveness have come up dry. Some studies have found that certain less restrictive measures have lowered contagion, such as border closures and banning large events like sports games. The most common refutation of these studies by Covidists is to mention that Sweden did not have the world’s lowest or Europe’s lowest number of COVID cases or deaths per million people. That would be a valid counterargument to the theory that lockdowns significantly exacerbate COVID contagion.
However, the theory put forward by the above studies and by anti-lockdown activists is that lockdowns have little to no effect on contagion, not that they cause contagion to soar. Thus, one would expect to see free states perform approximately average to highly restricted states, which is what is reflected in the data.
Governments have promoted the asymptomatic spread fallacy to justify The Terror.
Lockdowns were initiated worldwide in early 2020 with the promise that they would be a one-time event of a few weeks in order to prevent hospitals from being overburdened with COVID-19 cases. Over a year later, we have an abundance of evidence to show that free societies handle SARS-CoV-2 just as well as those with harsh restrictions. We still do not even have evidence that pre-symptomatic and asymptomatic contagion is anything more than an uncommon occurrence.
All of the “Lockdowns have saved thousands of lives” reports from mainstream media stem from poor quality studies based on overzealous projections of COVID deaths or unscientific post hoc claims. Humorously, the CDC’s best evidence for its claim that most contagion is asymptomatic is based on the inference of infectivity from Ct values, which it states on its own website is an invalid method of determining infectivity. Politicians’ “follow the science” tagline is an empty glittering generality. Scientific evidence does not support the theory that lockdowns significantly reduce SARS-CoV-2 contagion or deaths from COVID-19.
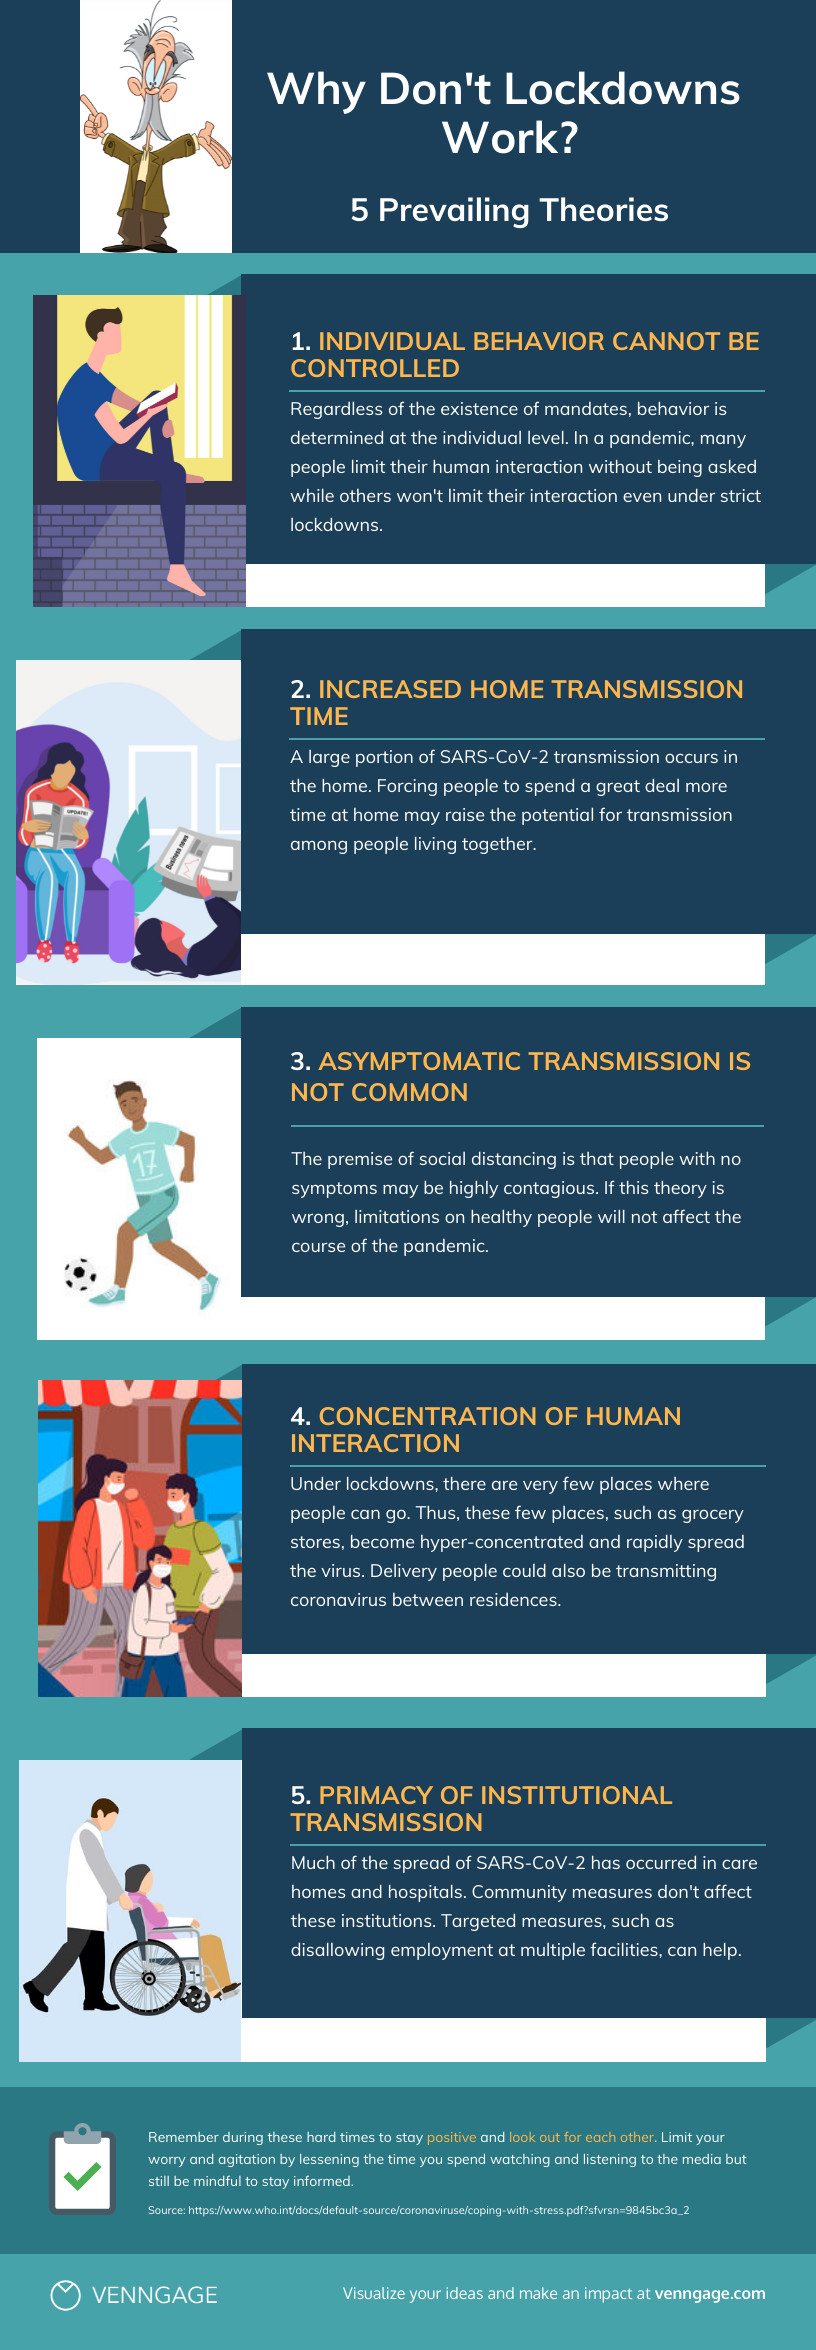
There is no single dominant theory on why lockdowns are ineffective at mitigating coronavirus. Below are some of the possible explanations put forth by scientists.